1 min read
Jet and Power BI - Better Together
Navigating the options for reporting and analytics tools can be challenging for Microsoft Dynamics 365 Business Central or Dynamics NAV users....
10 min read
You sat through the Power BI implementation. The dashboards look good. Data refreshes overnight, and nobody emails a workbook called Sales_FINAL_v7 any more.
Then someone looks at the margin chart and asks something the dashboard was never built to answer. Which customers? Price or mix? Is it only Germany?
A few minutes later, somebody says it out loud: ‘Can we just export it to Excel?’
It is easy to file this under training, licensing or stubbornness. It is more useful to read it as information. A person who leaves a governed BI environment to answer a question is telling you exactly where that environment stopped being useful. So the real question is not why people still use Excel. It is why they feel the need to leave BI to answer the next question.
The short answer. People export because the report answered their first question and they now have a second one, and Excel is the fastest place to chase it alone. Some of that is healthy. The rest points to missing detail, missing definitions or missing trust in the numbers. Conversational analytics can help with that second group, but only on data and models that are ready for it.

Because they have reached a question the report was not built to answer, and Excel is the quickest way to answer it themselves. The export is rarely the goal. It is the first step of an analysis. Microsoft says as much: when it announced better Excel export for tables and matrices in 2021, the stated business value was that many users want to continue their analysis in Excel as they explore data in Power BI.
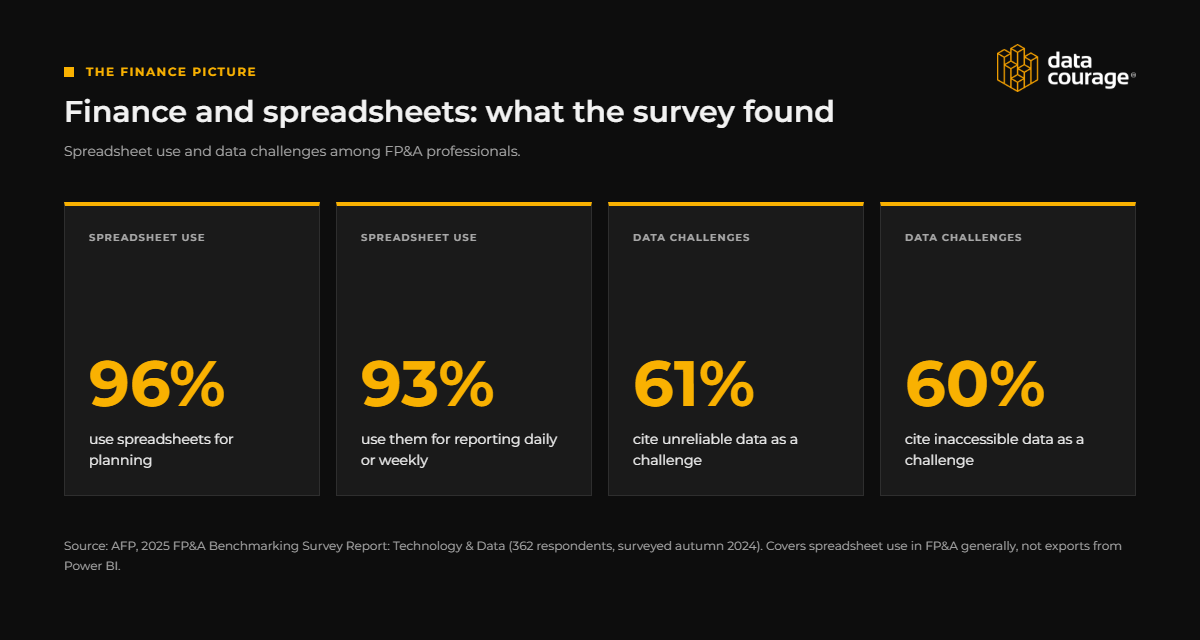
In the 2025 AFP FP&A Benchmarking Survey of 362 finance practitioners, 96% use spreadsheets for planning and 93% for reporting daily or weekly, while 61% cite unreliable data and 60% inaccessible data as challenges. It covers spreadsheets in FP&A generally, not exports from Power BI, but where data is hard to trust or reach, people build their own route to it.
A dashboard is a set of answers to questions somebody predicted. It does that job well: the same numbers, the same definitions, visible to everyone. The trouble starts when a number moves and the viewer asks why:
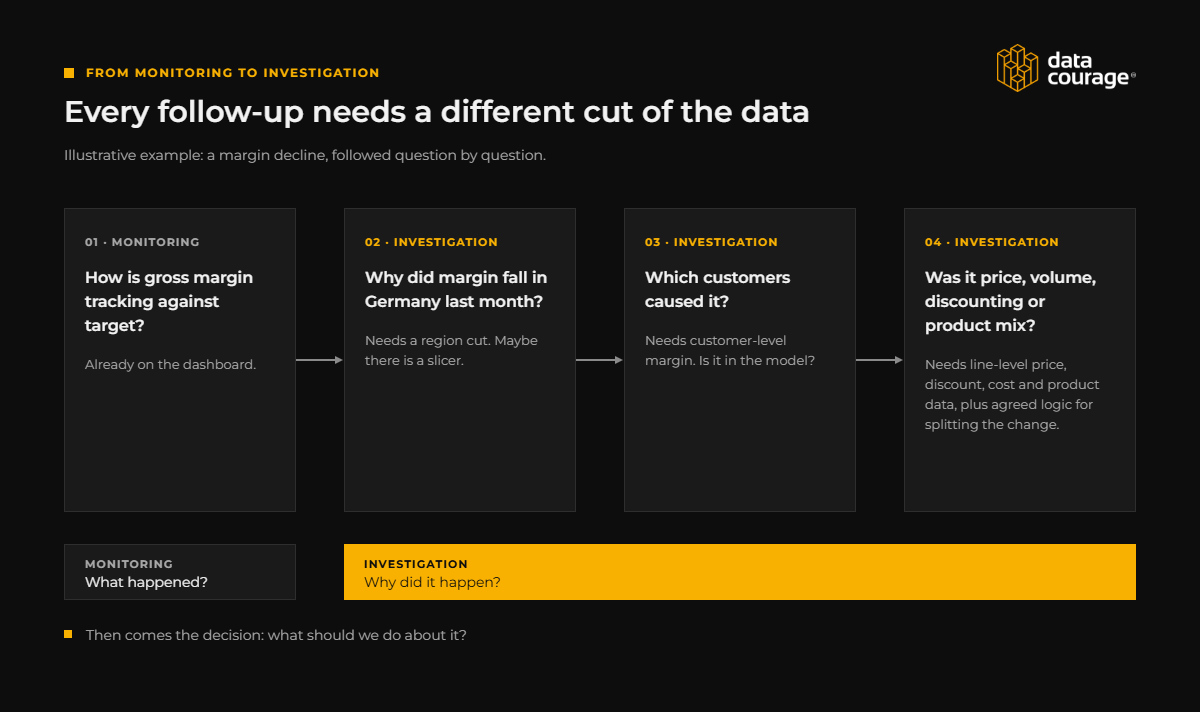
Each question is narrower than the last and needs a different cut of the data. A well-designed report anticipates the second. By the fourth, nobody has built that page, and nobody could have: the fourth question only exists once the third answer is known.
The first question is monitoring. The other three are investigation. A decision follows. Three different jobs:
Investigation is where many people reach for the export button, and Excel is where the decision often gets written up.
Excel gives people a grid they can see and touch, the freedom to change shape without asking permission, and room for scenarios and half-formed ideas. Microsoft’s own training material calls it arguably the most common data analysis tool for information workers, and its documentation describes connecting Excel to Power BI semantic models so people can build PivotTables on governed data.
The Analyze in Excel checklist from Data Goblins, hosted by SQLBI, weighs three cases. For a finance analyst whose ad hoc regional pricing analyses were not repeatable, Analyze in Excel was the right solution. For an engineer who asked for a daily export of monitoring data, it was not, and the team built a Power BI report to replace the export-based workflow. The author’s warning is worth repeating: Analyze in Excel can occasionally be an over-used bandage for export requests, rather than addressing the root business problem.
So two different things hide behind ‘export to Excel’:
Nothing in the first group is a problem to solve. Everything in the second is a question to ask.
When the same export is repeated, reshaped the same way each time, or used to fix a number the model should already provide. One export tells you nothing. A pattern tells you what is missing. Four patterns worth watching:
High export volume is a fair signal, not a verdict. Ten exports for ten different purposes is a healthy tool being used. Ten exports for the same purpose is a conversation you need to have, and it starts with the Super User’s question: what are you going to do with it?
Mostly in stale versions, unreviewed logic and governance that stops at the file. Many exports follow the same loop, and each unanswered question restarts it.
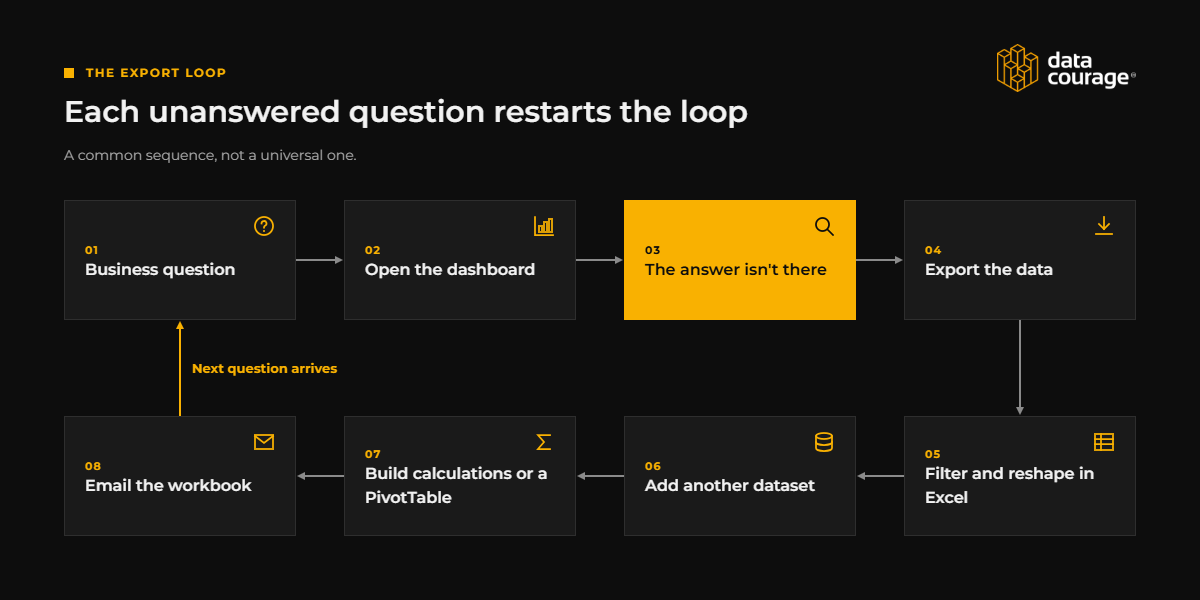
Because every new question needs a person with model access and the skills to answer it, and those people have limited time. The cost is not only the wait. It is what the analysts are not doing while they answer.
One data professional, writing on Substack, describes being asked, multiple times a day, ‘How do I export the data to Excel?’ His conclusion is that data teams should meet users where they are. We agree with half of that. Not every business user wants to build reports: the same practitioner describes users whose skills stop at drop-down filters, and says the vast majority sit somewhere in between.
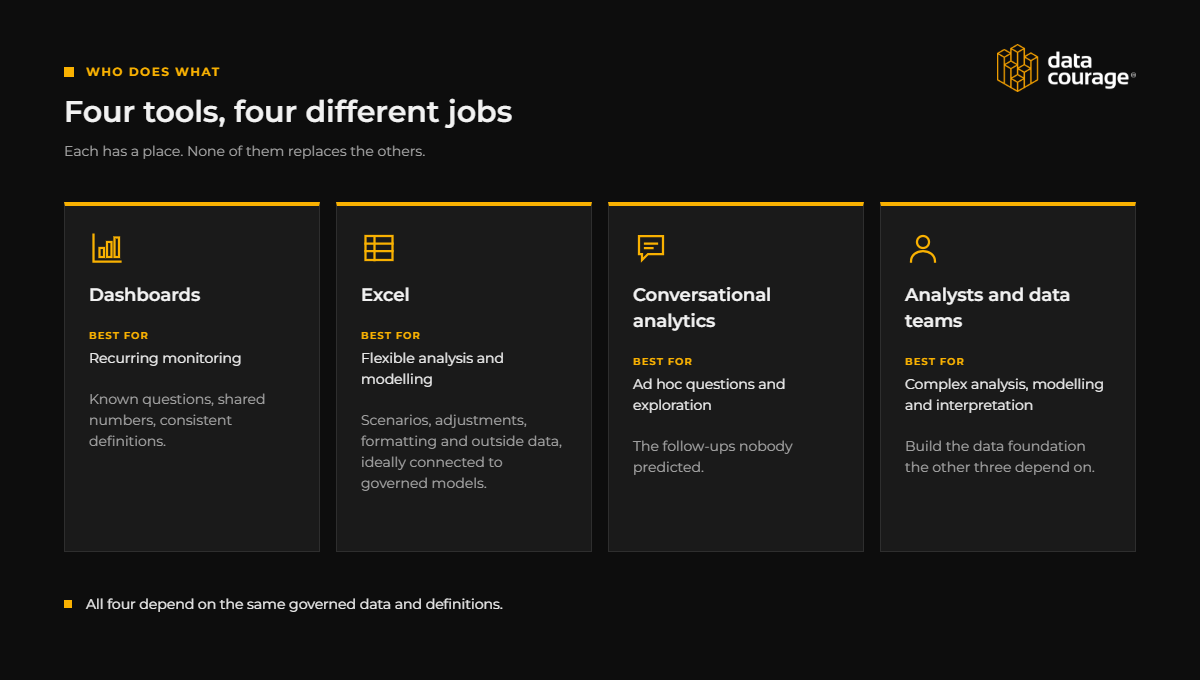
None of this makes analysts surplus. They do what dashboards, Excel and AI all depend on: complex analysis, modelling, interpretation and building a data foundation worth trusting.
Conversational analytics lets a person ask a business question in everyday language and get an answer generated from governed data, with the option to ask a follow-up. It sits between ‘export it to Excel’ and ‘ask the BI team’.
This is the problem we are working on at Data Courage: making the next business question as easy to ask as the first one was to see on a dashboard.
Microsoft is building towards this too: Copilot in Power BI supports natural-language interaction with data, and Fabric data agents let organisations build question-and-answer experiences over lakehouses, warehouses, Power BI semantic models and other sources. Microsoft says agents generate read queries only and honour the user’s permissions, including row-level and column-level security. Parts of this are still in preview, so check the status of anything you plan around.
It is a better answer to one specific kind of question: the ad hoc follow-up that today triggers a ticket or an export. It is not a shortcut around foundations. A recent post on Microsoft’s Fabric Updates Blog puts the challenge plainly: the hard part is not enabling the conversation, it is making sure the answer is correct.
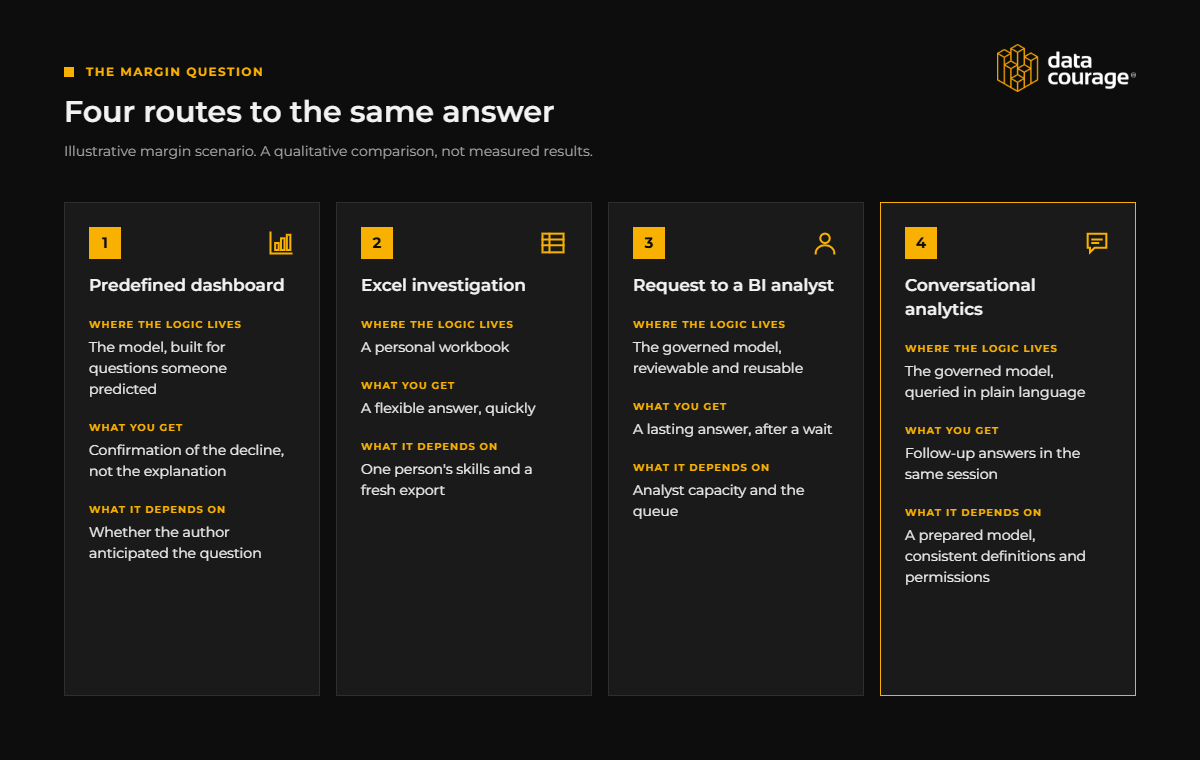
An illustrative scenario, not a customer case: the margin question again, from the CFO’s chair. Which customers drove the fall in Germany, and was it price, discounts, mix or cost?
The four routes differ less in speed than in where the logic ends up: in a personal file, in a governed model after a wait, or in a governed model that can be queried in plain language.
Data Courage’s conversational analytics can work across multiple business data sources and lets people ask follow-up questions in plain language, so the next question does not start another export.

No. They do different jobs, and the conversational layer is built on the same models the others use. Microsoft describes the same semantic models as powering the dashboards the business uses daily and being kept up to date as a by-product of that use.
A conversational layer answers confidently from whatever it is given. Ambiguous definitions, untidy data and loose permissions do not disappear. They become wrong answers delivered faster.
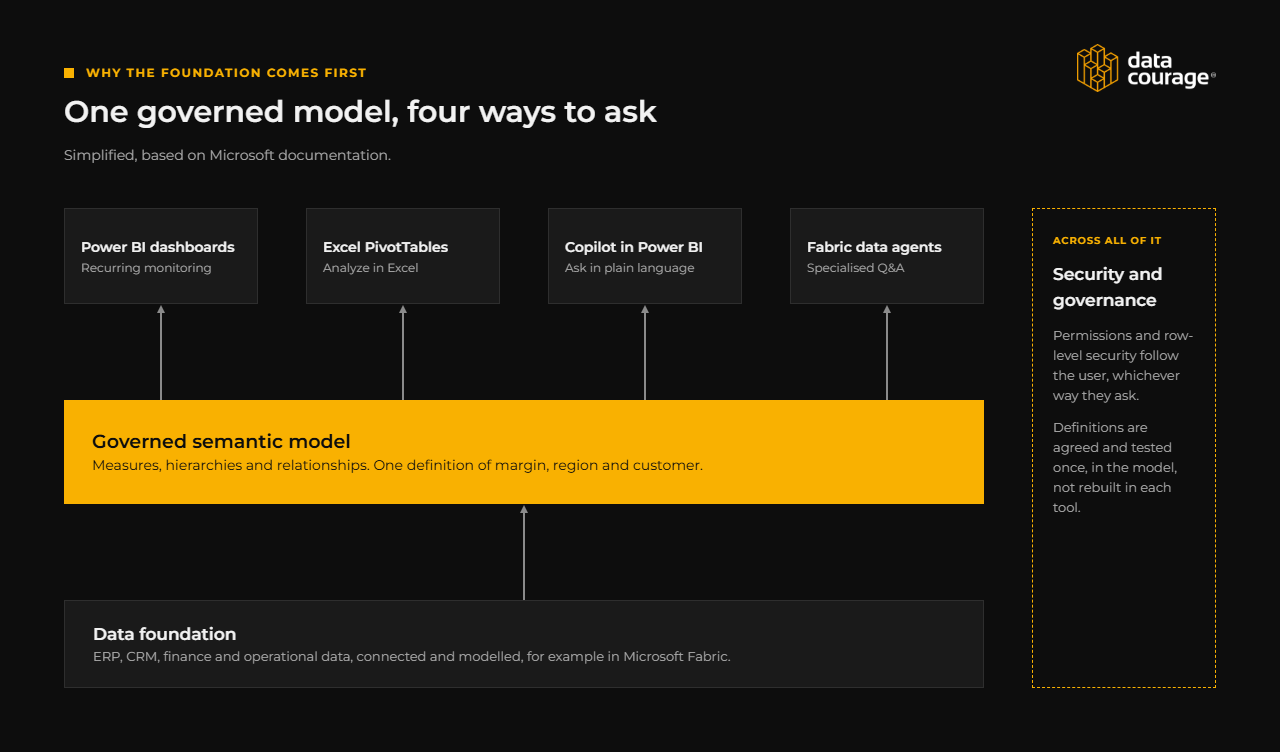
Data Courage builds data platforms on Microsoft Fabric and Power BI models that bring ERP, CRM, finance and operational data together, so that dashboards and conversational analytics both have something reliable to stand on.

A practical sequence:
Where we fit. Data Courage works on both halves of this: the foundation underneath and the questions on top. Besides conversational analytics, we publish AI apps for Dynamics 365 Business Central, including AI Financial Intelligence, which lets finance users generate P&L and Balance Sheet reports and then ask follow-up questions in natural language inside Business Central, with support for dimensions, saved insights and export options. It is focused on finance and designed to complement standard reports, not replace them. As with any tool in this space, results depend on the quality of the data and the set-up underneath.
Generate P&L and Balance Sheet reports, then ask follow-up questions in natural language without leaving Business Central.

Dashboards will keep answering the first question, and Excel will keep answering plenty of second ones. The aim is not to stop that. It is to know which second questions keep coming back.
The export button is not going anywhere, and it should not. The useful habit is to treat each export as a question: what was this person trying to find out, and why could they not find it where the data lives?
Bring one report your team keeps exporting to Excel, and we will give you a second opinion on what is missing underneath it.
Usually because they have a follow-up question the report was not built to answer. They want to see the underlying rows, reshape the data, combine it with another file or add their own judgement. Repeated identical exports are a sign that something is missing from the model or the report.
Not by itself. One-off exploration, scenario modelling and working with outside data are good uses of Excel. It becomes a concern when the same export is repeated, when the workbook becomes the version people quote, or when exports recalculate numbers the model should provide. Microsoft provides admin and report-level export settings for organisations that need tighter control.
An export creates a file containing the data from a visual at that moment. Analyze in Excel creates a workbook connected to the Power BI semantic model, so a PivotTable can be refreshed and built on the model’s measures.
No. Dashboards remain the efficient way to monitor recurring metrics that many people need to see in the same form. Conversational analytics suits ad hoc and follow-up questions.
It can when the model underneath is prepared, but not automatically. Microsoft says that without proper preparation Copilot can generate less helpful and inaccurate results, and that AI instructions are interpreted rather than guaranteed. Test with questions whose answers you already know before rolling anything out.
Sort a month of requests into new logic, new cuts of existing data and questions about what a number means. Then fix the gaps that sorting reveals and, where the model is ready, pilot conversational analytics for follow-up questions.

1 min read
Navigating the options for reporting and analytics tools can be challenging for Microsoft Dynamics 365 Business Central or Dynamics NAV users....

1 min read
Finance teams do not need another place to check numbers. They already have reports, spreadsheets, dashboards, exports, month-end packs, and standard...

1 min read
At FabCon Atlanta 2026, Microsoft didn’t just announce new Fabric features. It reframed how organizations are expected to interact with data and AI...
