
.png?width=1200&length=1200&name=Rethinking%20finance%20in%20the%20age%20of%20AI%20in%20Business%20Central%20(1).png)
1 min read
AI Financial Intelligence v.2 Release
We're thrilled to bring you the latest enhancements to the AI Financial Intelligence App for Business Central this March 2024.
3 min read
Every number in your business reveals something. It may signal a trend, expose a risk, or show where growth is happening. When that data hides in spreadsheets or clunky reports, it becomes hard to act on it.
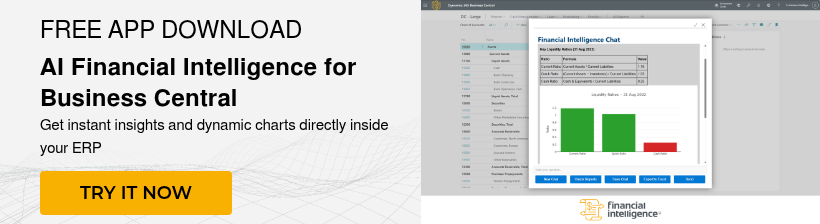
This app lets finance teams ask questions in everyday language and receive instant insights without needing to build a report. Whether someone needs a sales breakdown or a profit and loss view, the answers appear right inside the ERP, saving time and reducing back-and-forth with IT or data analysts.
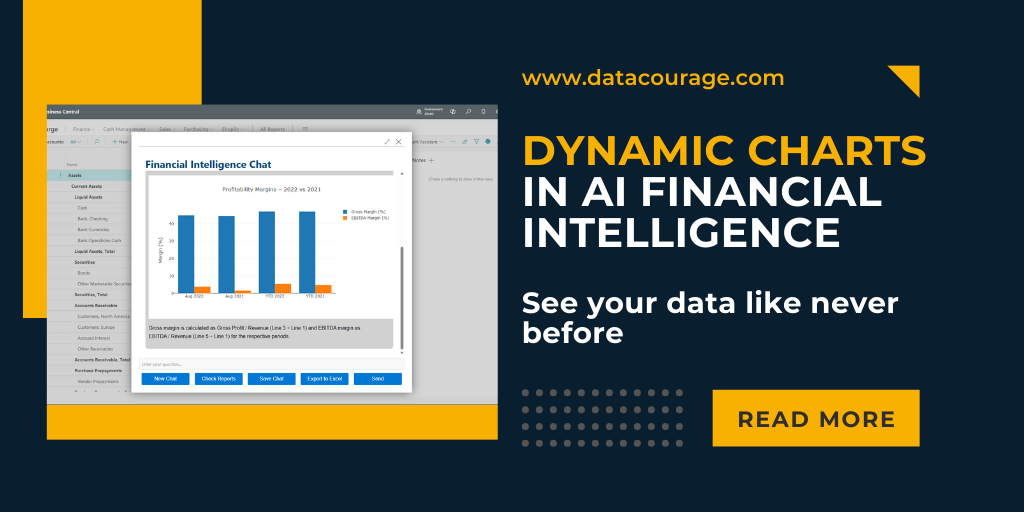
The newest update to AI Financial Intelligence takes the experience even further. Now, users not only receive a written answer, but also get a visual one. The new dynamic charts feature automatically turns financial insights into clear, readable visuals.
Seeing data this way makes analysis quicker. You can spot patterns faster and explain results more clearly to other teams or leaders. The visual layer also helps identify outliers or gaps in performance with less effort.
One of the key benefits of the new feature is that everything happens within Dynamics 365 Business Central. The charting lives directly in the ERP. Teams don’t need to export data, open another platform, or worry about syncing results between systems.
The app also adjusts the visuals automatically depending on the screen size. Whether someone views the results on a desktop, tablet, or phone, the chart remains readable and clean. This flexibility supports busy finance professionals who need to access answers during meetings or while travelling.
Because everything stays in the ERP, the data remains secure. There are no open data flows to other tools. Businesses maintain ERP-grade security without sacrificing speed or ease of use.
Today’s finance teams manage more data than ever before. Between growth targets, cost control, and forecasting, they need to see the story behind their numbers without delay.
Traditional reports often require hours of formatting or analysis. Even then, the results can feel unclear or open to interpretation. Visuals help resolve this problem. They make trends obvious, reduce the chance of misunderstanding, and speed up decision-making.
A clear graph can say more in five seconds than a spreadsheet says in five minutes. When teams see the same picture, alignment becomes easier. Questions shift from “what happened” to “what do we do next?”
These updates give teams more flexibility in how they use the app, whether they want to collaborate, report, or explore deeper insights over time.
Many business intelligence tools offer reporting features, but most of them operate outside the ERP. That means businesses need to pull data into another tool, learn a new interface, or work with IT to set things up.
AI Financial Intelligence takes a different approach. It lives inside Business Central and connects directly to live ERP data. There’s no duplication. There’s no need to understand formulas or build dashboards from scratch.
Key features include:
All of this happens in a secure ERP-native environment that fits the daily workflow of finance professionals. The experience feels familiar but adds a powerful layer of intelligence that unlocks faster, better insights.

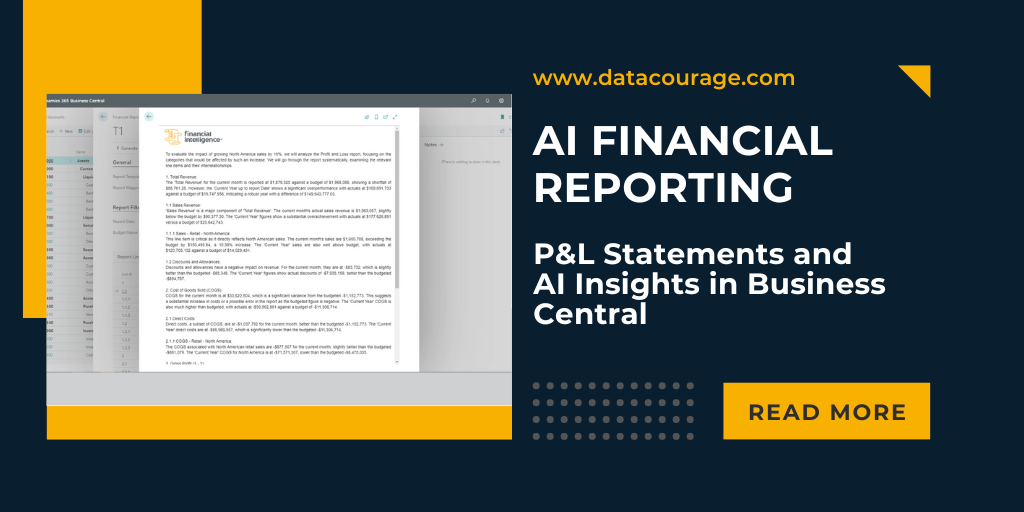
Good financial reporting supports action. It helps teams see what worked, what didn’t, and what needs to change. By combining fast answers with smart visuals, AI Financial Intelligence helps teams gain confidence in their numbers.
A CFO preparing for a board meeting can ask about quarter-over-quarter revenue and get a clear chart to present. A controller reviewing costs can quickly spot which areas saw the biggest increases. A finance analyst looking for margin improvement opportunities can identify trends in seconds.
This is more than reporting. It’s a new way to interact with ERP data. It’s a shift from static views to living insights that evolve as the business does.
If your team already uses AI Financial Intelligence in Dynamics 365 Business Central, the new charting feature is now available. Try a simple question like, “What were our top five selling items last month?” and see how the chart shows the answer at a glance.
If your team hasn’t tried the app yet, now is a great time to see how it helps finance teams reduce manual work and improve decision quality. You don’t need to install a separate system or train your team on complex tools. Just ask, and the answers will come with clarity.
You already have the numbers. With AI Financial Intelligence, you can finally understand what they mean—faster and clearer than ever before.

1 min read
We're thrilled to bring you the latest enhancements to the AI Financial Intelligence App for Business Central this March 2024.
1 min read
Creating detailed and accurate Profit and Loss (P&L) Statements is often a complex and time-consuming task for businesses. But does it have to be?

1 min read
In the financial world, accuracy is everything, and there's little room for error. That's precisely why AI has become such a game-changer, especially...
